![]()
| The Margin of Competition in the
Short Run is the Off Peak Seasonal Cycle: Competitive Prices Resulting from Smoothing the Load across the Months Prices and Consumer Surplus at Full Utilization of Reasonably Available Capacity Summary of the Effects of Competition in the Short Run
|
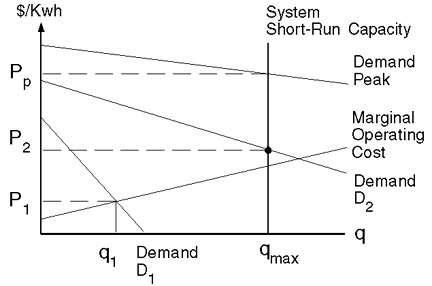
 In this chapter we analyze the short-run impacts of a move to competition. Several issues emerge. Currently, the existing power production facilities in the United States are not employed to the limit of their physical capabilities. Regulations cause this under utilization. Competition will employ these intermittently idle facilities. Here we attempt to estimate how much under-used capacity exists and the amount of additional power that will be forthcoming when the shackles of regulation are released. Our focus at the outset is on the short-run adjustment process. That is, we only examine the impact of competition on existing facilities in this chapter. Electric power production and distribution is uncommon in at least one important way. Massive facilities are used to produce only one product. These facilities, once constructed, remain viable for a very long time subject to periodic maintenance. Power plants are specialized resources. Once the capital is in place there is little that it can be used for except to produce electricity. Add to this the fact that most plants last for a relatively long period of time, and we are left with the conclusion that the long-run profitability of capital is not the prime issue that it is in other industries. Grocery stores come and go as the returns to capital in that industry vary. This is not the case with electric power production. There is a lot of capital in place in the industry that will remain in production regardless of the return it enjoys. Only the long-run investment decision to add new capital hinges on the current or expected future return to capital. In the short run, which can be quite long in calendar time, productive capacity does not depend on market price. The short-run supply of electricity is made up from the existing firms in the industry. The intersection of short-run supply and demand determines price. At the practical, plant level, so long as a facility can recover all of its marginal operating costs, it produces output and contributes supply to satisfy demand at the market equilibrium price. In a competitive market, existing facilities that are specialized to production in a single industry will continue to operate regardless of their return on investment so long as they recover their incremental operating costs. In the electric utility industry this means that all power plants that receive revenues in excess of their operating costs will continue production in a competitive regime. note 1 Competitive price will ration consumption and exhaust capacity at or above a price equal to marginal operating cost. We employ this approach to forecast the near-term competitive-market price of electricity. The striking fact about the regulated electric power industry is that there is a substantial amount of capacity under utilization that exists only because of regulation. Notice that we do not use the phrase "excess capacity." In the current state of electric power pricing, off-peak users of electricity pay very nearly the same price as peak-period users. This causes existing capacity to be under employed in the off-peak periods. We ultimately address the question of whether peak capacity is excessive. But that issue aside, the current productive capacity in the electric power industry, which may or may not be excessive in the peak periods, is definitely capable of generating more output in the off peak. At the same time, consumers in one political subdivision pay prices determined not by the forces of supply and demand, but instead by some artifact of accounting records and regulatory interpretation. This means that their neighbors, by random chance, can pay significantly higher or lower prices for the same product. This is not the way that competition normally works. The current stock of physical capital represents a limit on the potential increases in industry output in the short run. Existing electric generators can only supply so much power. However, industry production only reaches this nation-wide capacity constraint occasionally; this occurs only in the two peak summer months, July and August. The rest of the time, the industry is producing at reduced load. In July and August, actual consumption is closest to system capability. Thus, when competition emerges, average price will decline the least in July and August. On the other hand, price can fall substantially in the off-peak periods, and consumption can increase. This is where competition will initially change the industry. The Margin of Competition in the Short Run is the Off Peak Competition in electric power in the short run is a process in which the price of off-peak power is driven down to the point where capacity is fully utilized. Such an idea has a rich history in the economics literature. note 2 Indeed, many researchers over the years have argued that the hallmark of rate regulation in the utility industries has been the mispricing across the production-consumption cycle. Numerous papers have been written, and the theory concerning the efficient peak and off-peak prices has been pounded out and galvanized. It can be summarized succinctly: First, price should be no lower than marginal operating cost. Second, given a capacity constraint, the efficient price is one that rations demand. For example, consider an off-peak period with insubstantial demand. The efficient price is marginal operating cost. At this price, quantity demanded does not exhaust capacity. Hence, there is no reason to use price to ration capacity. If some capacity is idle, price should fall to the value of marginal operating cost in order to induce as much consumption as possible subject to recovering the opportunity cost of other resources embodied in the recovery of marginal operating cost. Capacity is economically free during these periods and should be treated as such. Examine Figure 1. When demand is slack, D1, the optimal price is P1 and consumption is q1. Next, consider an off-peak demand that is sufficiently large to exhaust capacity at a price equal to marginal operating costs. This is demand D2 in Figure 1.
Price in this off-peak period should be sufficiently high to ration capacity. Price should be set sufficiently above marginal operating costs so that quantity demanded is equal to the capacity output level. In other words, the rate of consumption in this off-peak period should be the same as the rate of consumption in the peak period. The optimal price in this situation is P2, and consumption is qmax. Indeed, when prices are set efficiently, the thing that designates the peak period is the height of price in that period not the level of consumption. The peak period is characterized as the period which requires the highest price in order to ration the scarce capacity. This demand is labeled Peak in Figure 1, and the efficient price is Pp. Output is still qmax. Only price has adjusted. Economic researchers have noted the tendency for regulators, for whatever reason, to approve rates that are inefficiently high in the off peak. A standard regulated rate schedule has peak and off-peak prices that are nearly the same. Possibly, there is some price discount that is granted to off-peak users, but generally it is less than the efficient amount. This is clear because there remains a substantial variation in consumption over the cycle. The efficient prices that would equate consumption levels between peak and off-peak periods are not imposed by regulators. By implication, the move to competition will remedy this inefficiency. For instance, as casual observation reveals, the price of gasoline is lowest in the winter months, when miles driven are the lowest, and price is highest in the summer when good weather and vacations induce increased family travel. In the case of gasoline, the price varies from season to season to ration demand. This does not currently happen in electricity. Regulations keep the prices high in the off-peak periods. Therefore, there is considerable untapped capacity in the generation of electricity. There are numerous examples of markets where prices vary daily or seasonally to smooth out demand. The principle is broad in practice, and electricity under competition will be no exception. Under competition with the current production capacity, off-peak prices will be driven down and the capacity utilization differential between peak and off-peak will decline. Monthly production and consumption cycles vary substantially. The peak months are July and August. During these months, consumption has averaged 272 billion kwh over the two years 1993 and 1994. note 3 By contrast, consumption in the off-peak months has averaged 241 billion kwh. The off-peak consumption is about 13 percent less than the peak. While consumption has varied, price has not, at least not that much. Average price in the peak is 7.1 cents per kwh. Average price in the off peak is 6.7 cents per kwh. Consumption varies by 13 percent, but price only varies by 3 percent. We predict that competition will reverse this contrast. Competition will cause price to vary more and the level of consumption less. There are actually multiple production and consumption cycles. Demand for electricity varies over the months, during the week, during the day, and interregionally along all these lines. In a peak load analysis of the electric power industry, the argument is that the industry can supply at all times the same level of electricity that it currently supplies in the peak months, weeks, days, or even hours. Scheduled maintenance and reliability are factors in this analysis; we return to address these issues in a moment. Recognize that during some off-peak periods, demand may be insubstantial so that even efficient pricing will not completely flatten the load curve. Even so, the current consumption levels of electricity are too low in the off-peak periods because current regulations do not allow the price to vary as much as it will under competition. That is, under competition with the current production capacity, off-peak prices will be driven down, and the capacity utilization differential between peak and off-peak will decline. The limit of competitive efficiency is real time pricing. While that pinnacle of pricing perfection may take some time to develop, we anticipate that demand management programs will expand under competition as they have in the telecommunications industry. With enhanced demand and price management, we expect that the immediate effect on average consumers is that they will find that price falls in what are now off-peak periods. They will increase their off-peak use as a result. For instance, a current residential consumer has to pay the same price during the morning and evening peak periods to heat water as she/he pays on the weekends or during the low-demand early morning hours. Under competition this regulatory induced intransigence will fade and the prices during off-peak hours will fall. Residential consumers will be induced to buy larger electric hot water heaters with timers that heat during the late night/ early morning (low price) interval and idle the heating elements during the high-priced daily peaks. Price per unit of hot water falls. This argument obviously extends to all consumers and across days and months. We expect that entrepreneurs with new ideas and approaches will enter as resellers or producers to ensure that what is currently under utilized capacity gets efficiently used throughout the day/month/year. What this means economically is that price will fall for off-peak or average demanders up to the point where consumption equals the reliable capacity constraint. Competition should face few impediments in flattening consumption across the months. Competition will force utilities to price power low enough in the off-peak months so that capacity is fully utilized. This can happen almost immediately because there are no additional costs of distribution. Consumers are already metered monthly. No additional measuring and meter reading is necessary to charge prices on a monthly basis. Consumers can know in advance what they are going to pay. It will be the price low enough to induce them to use all reliably available capacity currently on the system. Recognize that nothing in this scenario is different from what happens now. There is virtually no additional paperwork or monitoring required for competition to work. Moreover, because of the threat of competition, power companies will be forced to lower their bills to consumers without widespread switching of providers. In the end, competition will leave most customers with no hassles and a lower bill. A large number of AT&T long-distance consumers got exactly this benefit without any action on their part as AT&T cut the price of long-distance service when faced with competition from Sprint and MCI. Flattening consumption across the months should create no additional system control requirements. Monthly consumption in January and February is no more volatile than monthly consumption in July and August. The system is currently able to price July and August in advance and then handle the spikes that occur around average monthly consumption. We argue that the system can handle consumption of this same magnitude in the other ten months. In a free and open competitive power market, it will be a relatively simple matter for competitive power marketers and aggregators (who buy power in bulk to resell to groups of customers) to sell power on a monthly basis—even to residential consumers. In the extreme, there is no reason why a residential consumer cannot negotiate directly with a power producer. If Georgia Power wants to sell electricity to residential customers in Charlotte, North Carolina, it can pay Duke Power for the cost of transmitting and distributing the power. Again, this is the same model as employed in long-distance telephony. We discuss efficient transmission pricing below. Most importantly, competition should be allowed to drive price down because it is a social loss for the physical plant of the electric power industry to be under used in all but two months of the year. The benefits of competition in part are redistributive. That is, the lower prices consumers will enjoy will come out of the revenues received by the utilities. However, competition generates a net social gain. The increased capacity utilization implies an increase in consumer surplus over and above the cost to the utilities. The economy is made better by competition. Seasonal Cycle: Competitive Prices Resulting from Smoothing the Load across the Months The construction of the forecast of the competitive result that we call seasonal smoothing can be seen by inspection of Figure 2.
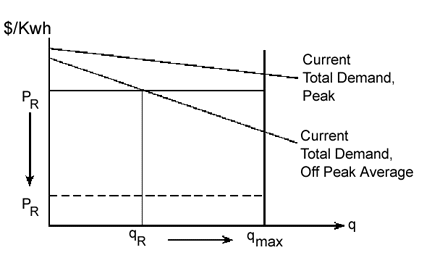
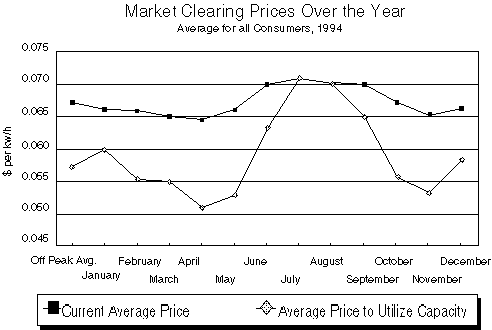
Shown there is demand for peak and average off-peak consumers. Since price is essentially the same peak and off peak, we label this price PR. This price clears the market during the peak period, but leaves slack capacity in the off-peak months. Off-peak consumption is qR. Unused capacity is qmax - qR. This capacity can be put to use by the lowering of price to pC. Competition will cause the consumption level in the off-peak months to equal that in the peak months. The question becomes, what is the required reduction in price to induce an increase in consumption in the off-peak periods? We need to find the required reduction in price, PR - PC, to induce an increase in consumption from qR to qmax. To do this, we estimate demand elasticity. Elasticity is a measure of the relative slope of the demand curve. It reflects the relative intensity of consumers’ preference for electricity and depicts consumers response to price changes. From the estimate of average demand elasticity, we forecast the price decline in the off peak that will be required to induce this additional consumption. Our estimates of electricity demand in the United States are presented in Volume II of this report. In succinct summary, we find total demand to have an average price elasticity of around -1. (The precise number is -.9757.) Elasticity is the percentage of change in consumption for a given percentage change in price. This means that in this case the efficient change in consumption in percentage terms requires an equal but opposite percentage change in price. We can solve for the price that will prevail under full and open competition when off-peak idle capacity is efficiently put to use. Table 1 shows the monthly total consumption levels, current prices, and the forecast competitive prices that will induce capacity utilization. The average consumption in July and August is the target. Consumption in these two months averages 272 billion kilowatt hours. Consider the current consumption rate in January, which is 250 billion kwh. The required increase in consumption to fully use capacity is (272 - 250)/272 = 8.1 percent. To induce this increase, given a price elasticity of -1, price must fall by 8.1 percent. Given the current January price of 6.6 cents/kwh, the new 8.1 percent lower price is 6.0 cents per kwh. Similarly, price is predicted to fall in each off-peak month. The current average off-peak price is 6.7 cents/kwh. The average competitive off-peak price is forecast to be 5.7 cents/kwh. On average, competition will lower electricity prices by about a penny per kwh in the short run based on seasonal smoothing. In the current regime, electricity prices are not uniform across the user classes. Each class within the total pays a different price: residential the highest, industrial the lowest, and commercial demanders in-between. The current distribution of prices in July and August is such that residential consumers pay 8.1 cents/kwh, commercial clients, 7.2 cents/kwh, and industrial users, 5 cents/kwh. The distribution of prices raises a number of interesting questions about the nature of a competitive regime. In all probability, the current mix of prices across the user classes is driven both by cost considerations as well as willingness-to-pay and current competitive alternatives. Residential consumers have the biggest demand of the three classes. Industrial users currently have some access to competitive markets. Because industrial users often have their own power sources, they can agree to purchase lower quality intermittent power from the utility. Also, the cost of distributing electricity to them and metering their usage is substantially lower per kwh than it is for residential customers. Competition will reduce the price differentials that are a result of demand considerations. However, it is likely to accentuate the differentials that are cost-based. Table 2 shows the distribution of the average seasonal-smoothing prices across months and customer classes. Average price in each month will fall to the point where capacity is fully utilized. However, the average price will be distributed across the customer classes. A simple forecast of the competitive outcome is that the relative prices across customer classes will stay the same. Residential consumers will still pay more than commercial customers, who pay more than industry. Table 2 shows our forecast. For instance, average residential off-peak price falls from 8.1 to 6.8 cents/kwh. While it is possible that the price differentials will compact as a result of competition, the average off-peak price for residential users will probably not fall much below 6.5 cents/kwh on average just based on monthly smoothing. This is because the average off-peak price does not change as a result of compacting the distribution of prices. The average price induces consumption to the capacity limit and at that limit, rations use. However, compacting the distribution of prices shifts the gains from competition marginally to favor residential and commercial customers relative to industrial users. How this aspect of the competitive market will play out is open to speculation and depends upon additional analysis of the cost of service by class. Even so, the average price will fall to the point where capacity is fully employed over the months in the year. note 4 Figure 3 demonstrates the current (1994) state of monthly prices and the competitive, market clearing prices (averaged over all classes of consumption). Note the higher variability in prices under competition. We have exchanged variability in consumption for variability in price. note 5
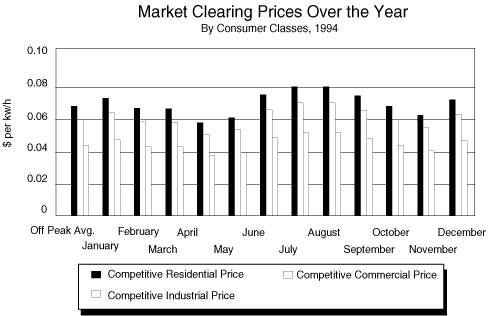
Figure 4 compares the competitive prices each month by class of customer. Note how the price for each class cycles across the months. These cycles follow the weather. A larger number of cooling-degree days leads to higher monthly prices. Again, while these prices cycle, the corresponding demand/load curve is flattened.
Competition drives price down and consumption up. Consumers gain. The standard approach to measuring this gain uses the concept called consumer surplus. Consumer surplus is the area under the demand curve and above price. note 6 The benefits of competition bestowed on consumers are measured as the increase in the area of consumer surplus. That is, as price goes down, the area under the demand curve and above price increases. The increase can be broken into two pieces. One is the amount that consumers’ bills would go down if they did not consume any additional electricity. The other is the net gain they get from the additional consumption they choose at the lower, competitive price. The net gain from the additional consumption is the area under the demand curve minus the extra dollars spent on this extra consumption. The net gain from the additional consumption is a net gain for society. It is called the "welfare triangle." Lower prices make consumers better off even if they do nothing. Moreover, lower prices offer consumers the option of purchasing additional quantities of the cheaper commodity. Both components add to consumer welfare when prices go down.
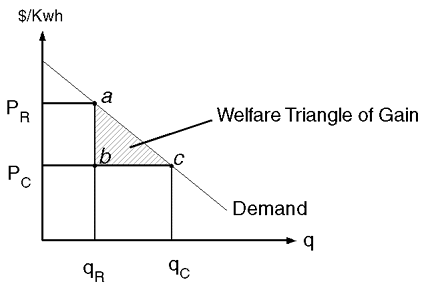
Examine Figure 5. The price decline from PR to P C increases consumer welfare by the area of Dabc. It is the net of the value of the extra electricity minus the price paid for the additional consumption. Computation of the first part of the increase in consumer surplus is relatively straightforward. This is just the net price reduction in each month shown in Table 1 multiplied by the current level of consumption in those months. When this is added up over the year we find that competition will increase consumer welfare by $22.1 billion annually. Again, this is the effect of lowering price on the current level of consumption. On average, competition that smooths the seasonal cycle of production will lower electricity prices by about a penny per kwh. As of 1994, the average residential consumer bill was $69.86, but this varies significantly across regions. The average residential consumer bill was $89.84 per month in Arizona, but only $44.93 in nearby Colorado. Examine Table 3. What will happen to these bills under competition if no additional power was consumed and rates were allowed to adjust over the annual cycle? The answer is the first piece of the change in consumer welfare. Based on a current average residential price of 8.3¢/kwh and a projected competitive price of about 6.8¢, our most conservative estimate is that the average current bill (with no quantity adjustment) will fall from about $69 to about $59.50. This is a decrease of about $9.50/per month on average. Using alternative methods, we later show that this bill could fall as low as $39 per month (quantity constant), reducing the average residential customer’s bill by about $30 per month. The average residential consumer fares very well under competition. One of the primary tenets of economics is the law of demand. The law says that people respond to lower prices by increasing their consumption. Some people respond more than others. Some respond quickly and others more slowly. It is nearly impossible for us to list all the ways that consumers will adapt to lower prices for power, but lower prices will have an impact on consumption. Lights will burn longer hours, and water heaters, clothes dryers, computers, yard lighting, security systems, and the like are used more. Falling rates will induce extra use of electricity and make a wide variety of appliances and services more attractive to consumers. For instance, some consumers will add additional hot water heaters, pool heaters, air conditioning, and similar devices where high prices have kept them out of the market. Some may switch from gas to electric heating and cooking. Real estate developers will switch at the margin to more electric appliances. Low and high income consumers will expand their use of cheap power. Commercial and industrial users will also react to lower prices. Some are expected to switch to more electricity intensive production processes. Based on our estimate of nearly unitary elastic demand, the lower prices cause consumers to buy more electricity in the off-peak months. For this they get benefits in excess of this cost. The second piece of the consumer welfare gain is estimated to be $1.9 billion annually. The present value of this annual gain is $15.8 billion. note 7 This represents the total value of price competition that would be gained by a move to retail wheeling based on seasonal smoothing. This is our lower bound estimate of the initial gains from opening the doors to competition. Flattening the load curve across the months of the year is just the first step in the competitive process. All off-peak periods will begin to be priced more efficiently. Moreover, our simple analysis of the seasonal cycle assumes that the industry will expand production in the off-peak months to reach the output achieved in the peak. In order to investigate the full extent of the potential short-run gains from competition as well as posit a justification of our assumption that competition will be able to smooth the seasonal cycle, it is necessary to examine the production side of the industry more closely. Electric power consumption varies across the months by an average of thirteen percent. The cycle in consumption is mimicked in production and is pervasive across other cycles within weeks and days, so much so that the total capacity utilization in the industry is only about 52 percent. In other words, total output of electricity is only 52 percent of its potential. It is instructive to examine the nature of this idle capital. Table 4 shows data taken from information collected by the North American Electric Reliability Council (NERC). NERC collects these data in order to assess production reliability. They survey most but not all power plants in the country. The information they disseminate involves the frequency and causes of production outages. Of total production reflected in these data (2.68 trillion kwh per year on average for 1990-1994) fossil fuel steam generation accounts for 68 percent. Nuclear accounts for 24 percent, hydro, 5 percent, and so on. The next column presents data on capability. Capability is capacity weighted by reliability. The relative capability numbers by type of facility vary from production. For instance, nuclear power makes up only 16 percent of industry capability. The implication of the fact that nuclear power is 16 percent of the capital stock but contributes 25 percent of actual production is that nuclear power plants are operated more closely to their capacity. No plant can operate at its maximum capacity continuously for the year. Plants require scheduled maintenance, and they break down randomly. The column labeled "Capability" in Table 4 reflects the number of hours in the year that the plant was ready for service. Capability deducts the maintenance time from the total hours of potential operation in the year in order to calculate an estimate of the maximum system output. The system capability utilization was only 60.3 percent over the years 1990-1994. In other words, the electric power industry only produced 60 percent of the power it could have produced even accounting for the time that production facilities were necessarily off line because of maintenance and repair. System capability utilization of 60 percent translates into system capacity utilization of 52 percent. Notice the distribution of capability across plant types. Fossil fuel plants are right at the system capability average of 60 percent. Nuclear facilities on the other hand achieved 93 percent utilization, while gas turbines and jet engines had utilization rates in single digits. The cause of the distribution of these numbers is no mystery. Capacity utilization is low because a large portion of the capital is idle a significant portion of the time. Fossil fuel steam plants operate on average around 5,000 hours per year, and they are on reserve for 2,000 hours. These reserve shutdown hours are time that the plant could be producing but does not because there is no demand for the power. Of course, as economists we are quick to add, there is no demand for the power at current prices. The productive capacity is available to produce the power if anyone wants it. The reason no one wants it is that it costs too much. If price falls, the quantity demanded will increase, and capacity can be more fully utilized. Table 4 shows the percent of time that facilities are idle during the year in reserve shutdown mode. Some capacity is idled more than other. The capability utilization rate for gas turbines and jet engines reflects the fact that these types of generators are principally used to supply power at the peak. They are facilities that start up and shut down cheaply. They can be brought on line quickly to satisfy momentary surges in electricity usage. Electricity engineers must satisfy usage as it comes. If everyone turns on their lights at the same moment, there will be a large surge in demand and the system must instantaneously produce more power. This kind of load control is a requirement of the system and is the reason for a divergence in the utilization rates across the types of production facilities. Part of the under utilization of plant capacity when the plant is running is due to a required reliability margin. Table 4 shows a forecast of the excess capacity in the system based on reserve power. This estimate is based on the available reserve hours by type of facility and does not include any additional power that may be available from reductions in the reliability margin. We have counted on a little extra power from nuclear plants and no extra power from hydro sources. The total system potential increase in production is nearly 800 billion kilowatts or a thirty percent jump, bringing system capacity utilization up to 70.7 percent. The important thing about this estimate of capacity utilization and availability is that it comes from sources that are available in the off-peak periods, and it is larger than the estimated increase that we projected from a simple flattening of the seasonal load curve. In other words, our estimate of the price declines caused by competition is both believable and conservative. Indeed, based on this analysis of capacity availability, we can more reasonably forecast a competitive increase in electricity production in the range of 25 percent. This gain can be accomplished by full utilization of conventional steam generating facilities. There is 684 billion kwh of reserve power in conventional steam generation, which is 25.5 percent of total production. Fully employing this brings the capacity of conventional steam driven plants up to about 71 percent based on total hours in the year. To repeat, our analysis here does not add any capital or equipment to the current state of the power industry. No new capacity is required to affect the changes we describe. Moreover, there is no reduction in maintenance or down time. Our expansion of output does not require any diminution of reliability margins. The analysis simply assumes that competition will exploit the current stock of capital to its capabilities at all moments in time, which are currently idled simply because of intransigent regulations. Prices and Consumer Surplus at Full Utilization of Reasonably Available Capacity If we assume that competition will force the electric utility industry to fully employ its base load capacity, we estimate that electricity production will increase by 25.5 percent. This forecast is based on full utilization of reserve production hours at conventional steam facilities. It is net of the hours required at these facilities for scheduled and unscheduled maintenance. It does not include increased production by the secondary, peak load sources of power such as gas turbines or even the combined cycle and multi-boiler/turbine units. Based on our demand estimates, a 25.5 percent increase in power production due to increased use of existing capacity will cause an equal percentage decline in price. note 8 The current average price to the final consumer is 6.9 cents/kwh. An increase in power production of 25.5 percent will cause price to fall to 5.1 cents/kwh. Lower prices have two separate impacts on consumers. First, the power that is currently being purchased is now cheaper. This increases consumer surplus, but the lower prices reduce producer welfare. In effect, there is a transfer of wealth from producers to consumers based on their current consumption/production levels when prices fall. Consumers are better off by some amount, but producers are worse off by an equal and offsetting amount. Second, lower prices induce additional consumption and production that makes both consumers and producers better off. The first part measures the gross amount by which consumers are better off by lower prices, and the second measures the net gain to all of society. The second part is labeled society’s welfare gain. Table 5 lists the household savings that will accrue to residential customers across the country and each state separately when competition employs capacity efficiently. The decline in price due to efficient capacity utilization implies a gain in consumer surplus of $58.9 billion annually. The gain in social welfare is $7.8 billion annually. These second-look estimates of the gains from competition based on enhanced capacity utilization are bigger than the first-cut seasonal smoothing estimates and bolster our claims about the extent of the welfare gains from competition. An important question from the point of view of the utilities is the impact of competition on revenues and profits. Based on our demand estimates, revenue will not be substantially affected by competitive price reductions. Price declines will induce consumption increases of nearly identical proportion. Revenue is essentially unchanged. Even though revenue does not change, the increase in output comes at some cost, since extra fuel is required to produce the additional output. Hence, the effect on net revenues and profits is negative. In order to investigate this aspect of the move to competition, an analysis of the cost structure of the industry is insightful. We will focus primarily on the investor-owned utilities. Table 6 shows average revenue and average cost statistics across the investor-owned electric utility industry. Note that the average prices are somewhat higher than those reported when all utilities are included. Total operation and maintenance cost for the industry is 3.8 cents/kwh compared to average revenues of 6.6 cents/kwh across all sales. From the remaining net revenue comes payments to debt holders, taxes, and funds available to stock holders. Our interest in Table 6 is focused on the cost components. There are several points of note. First, the average cost of production is relatively low compared to the overall average cost. Production operation and maintenance for fossil fuel plants and for nuclear plants is slightly larger than 2 cents/kwh. Fossil fuel plants operate at a cost of 2.2 cents/kwh while nuclear plants put power on the system at 2.1 cents/kwh. Included in the fossil fuel cost is the fuel itself which makes up a substantial proportion, 1.67 cents/kwh. The rest of cost is made up of transmission, distribution, and administration, plus the cost of purchased power. Purchased power is a two-way street, however. Purchased power is a cost to the utility when it buys power but a revenue when it is on the other side of the market. The price is about 4 cents per kwh. As we described above, competition will force the price of off-peak power down to the point where capacity is utilized. This will involve an increase in output of 13 to 25 percent. The question is, what will it cost? Based on our analysis of capacity, the increased power will come from conventional steam generation facilities. Table 6 shows that the major component of the marginal operating cost of these facilities, which is the fuel cost, is 1.67 cents/kwh. Running these plants more will involve some additional operation and maintenance. However, there will be little if any increase in scheduled maintenance, so the marginal maintenance issue is the increase in maintenance due to random break downs. Total operation and maintenance cost only accounts for 0.4 cents/kwh and forced-outage service hours only account for 23 percent of total service hours. Couple this with the fact that forced-outage hours only occur at 8 percent of service hours. In the final analysis, marginal operating cost for running the steam electric facilities full time is probably around 1.7 cents/kwh. Based on this, increasing total power production by 13 to 25 percent will increase cost of production for the investor-owned power companies by $5.05 to $9.61 billion. Competition may be able to squeeze other short-run efficiencies out of the system. We consider the possibility of reducing reliability margins. This is the amount of reserve capacity that is available at each moment in time in order to supply random peaks in electricity usage. Current estimates have the reliability margin at about 25 percent in the peak month, but this margin has varied substantially over the years. In the late 1960s, the reliability margin was below 15 percent when, by all accounts, system control technologies were far inferior to what we have now. On the other hand, it is expansive to forecast that competition can come up with distribution and marketing devices to allow all of the current, short-run underutilized capacity to be employed. Full utilization of capacity will require time-of-day, real-time pricing. This involves metering and contracting more intensively and extensively than is currently practiced. The industry has expanded substantially on this margin over the last decade. Even so, full capacity utilization will require more. How long it will take for competition to expand to the limit on these margins is an open question, and it is probably fanciful to expect that electricity usage at midnight will increase to the level seen at 7 a.m. even with advanced metering and demand control technologies. Summary of the Effects of Competition in the Short Run In spite of the uncertainty associated with long-term forecasts, it is worthwhile to assess the impact of our near-term expectations about the move to competition. First, let’s look at consumer surplus. Output expansion in the range of 13 to 25 percent with average price declines of one to two cents per kwh will increase consumer welfare by $22.1 to $58.9 billion annually. Of this, the net welfare gain to society and the economy will be $1.9 to $7.5 billion annually. Again, some of the change in consumer welfare measures the impact of lower prices only on consumers, while the net welfare gain measures the overall positive benefit to society, both consumers and producers, from lower prices. On the other side of the equation, some producers will lose. Falling prices for producers will make some existing firms worse off. While there is only a small revenue effect because demand is nearly unit elastic, expansion of output comes at a cost. Running fuel-fired facilities longer requires more fuel. Fuel cost is nearly two cents/kwh which translates intoincreased cost industry-wide of $5 to $10 billion annually in round numbers. Gains to consumers considerably outweigh losses to producers. However, the producer losses are not inconsequential. The lower prices received by some electric utilities will reduce their profits and create the capitalized losses called "stranded costs." Plus, there are costs of fuel for the extra generation of electricity that comes with competition. These estimates of increased annual costs imply fully capitalized total overall losses of between $47 and $120 billion to the producer firms depending on the output expansion scenario and the choice of the discount rate used in capitalizing the annual values. Nevertheless, the net gain is positive. The distribution of the gains and losses from competition are not uniform across the country. Producers receiving and consumers paying the highest prices will experience the biggest effects of competition. These utilities will be affected the most negatively; their customers will benefit the most. The biggest changes will be concentrated in California, New York, and the northeast. note 9 In addition to the short-run changes we have been analyzing, there will be other effects as consumers and producers adjust in the long run to lower prices for power. We analyze these effects in the next chapter. The primary thing to note is that the benefits of competition are even bigger in the long run. Notes:
|